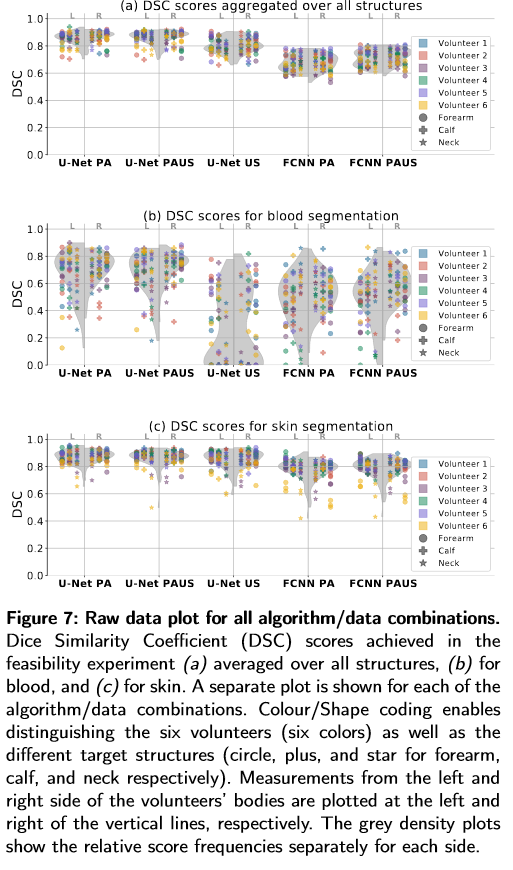
Add violin (or box)- and dots plot with shape- and/or color-coded dots to illustrate the hierarchical data structure.
Example (from Melanie's paper):
| reinkea | |
| Nov 29 2021, 1:08 PM |
| F2474213: Capture.PNG | |
| Nov 29 2021, 1:08 PM |
Add violin (or box)- and dots plot with shape- and/or color-coded dots to illustrate the hierarchical data structure.
Example (from Melanie's paper):