Is currently available in QmitkPlotWidget. Add it to MitkChart.
- SetCurveData(id, xValues, yValues, xLowerError, xUpperError, yLowerError, yUpperError)
- SetErrorPen
- SetErrorStylesSymbols
Is currently available in QmitkPlotWidget. Add it to MitkChart.
| Status | Assigned | Task | ||
|---|---|---|---|---|
| Wontfix | None | T23104 Deprecate QmitkPlotWidget | ||
| Duplicate | hentsch | T23384 Insert error functionality in MitkChart |
Error Bars are currently not supported by C3.js (see https://github.com/c3js/c3/issues/253)
We would need to implement it into C3.js ourselves or find a different solution. @hentsch and I will discuss it.
One current use case of error bars is in the CEST view:
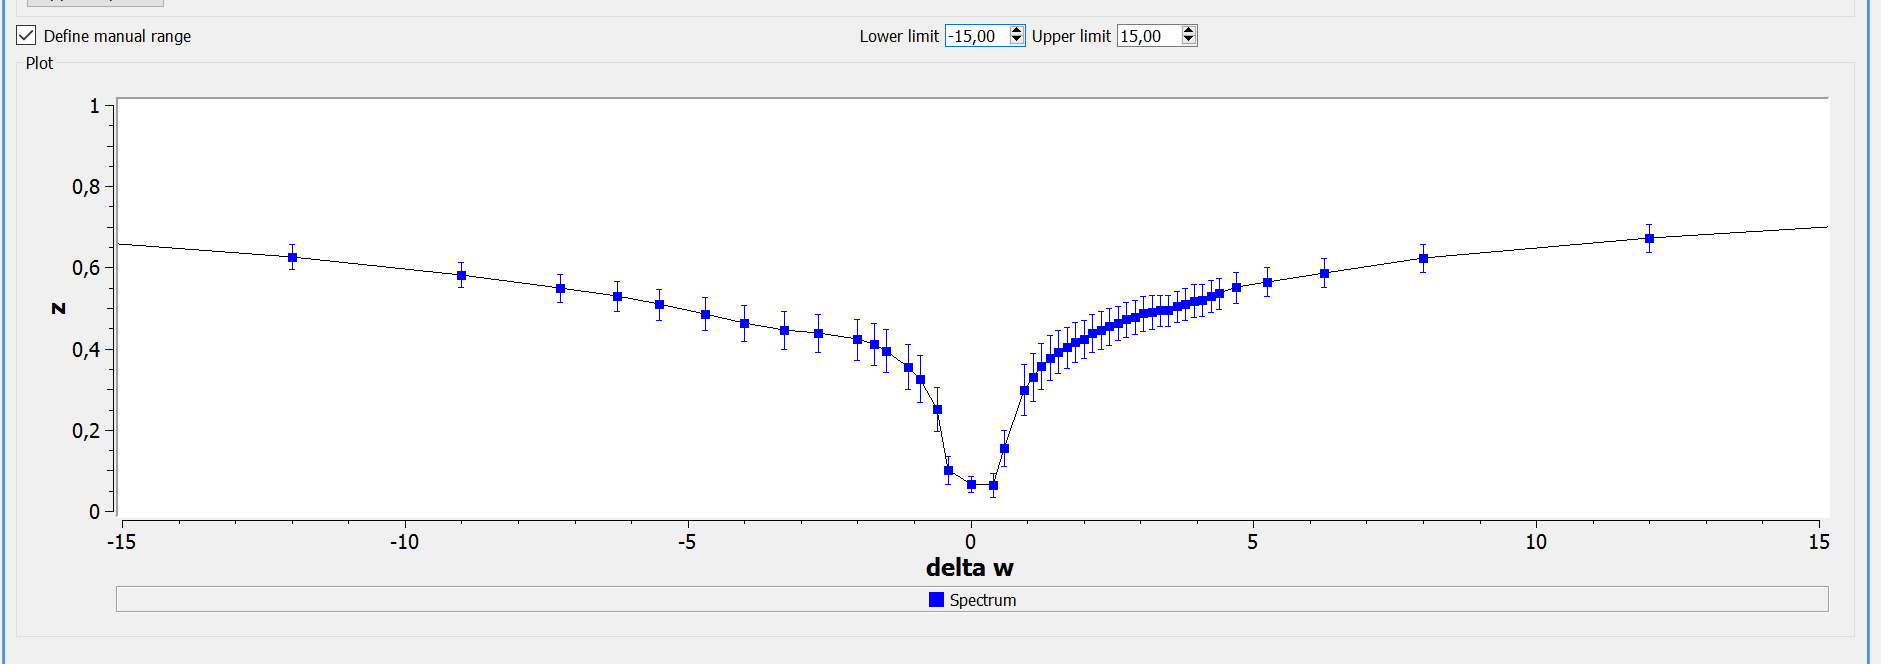
While this functionality only uses y error bars, it would be a good idea to support x error bars as well. Optionally supporting error corridors would be a nice to have, but is not something I would insist on.
Please note that error bars can be asymmetric.
following code implements error bars on bar charts:
var chart = c3.generate({
    data: {
        columns: [
            ['data1', 300, 350, 300, 200, 150, 230],
        ],
        types: {
            data1: 'bar',
        }
    },
        onresized: function () {
        updateErrorBars(); // need to be fixed..
    }

});

var errors = [50, 20, 30, 20, 40, 100];

var errorBars = d3.select('#chart svg .c3-chart').append('g');

errorBars.selectAll('path')
  .data(errors)
    .enter().append('path')
    .attr('class', function (d, i) { return 'error-line-' + i; });

function updateErrorBars() {

    d3.selectAll('.c3-bar').each(function (d, i) {

        var segList = this.pathSegList,
            yPos = segList.getItem(1).y,
            xPos = (segList.getItem(2).x + segList.getItem(0).x) / 2;

        errorBars.select('.error-line-' + i)
            .attr('d', function (d) {
                return 'M' + xPos + ',' + (yPos + d/2) + ' ' +
                    'L' + xPos + ',' + (yPos - d/2) + ' ' +
                    'M' + (xPos - 5) + ',' + (yPos + d/2) + ' ' +
                    'L' + (xPos + 5) + ',' + (yPos + d/2) + ' ' +
                    'M' + (xPos - 5) + ',' + (yPos - d/2) + ' ' +
                    'L' + (xPos + 5) + ',' + (yPos - d/2) + ' ' +
                    'z';
            });

    });
};
setTimeout(updateErrorBars, 500);
With line chart, it's problematic because of deprecated svg function that is no longer available in Chromium (which is used also by QWebEngineView). See https://stackoverflow.com/questions/34352624/alternative-for-deprecated-svg-pathseglist
Following code implements error bars also with line (works also with current chrome *yeah*):
var chart = c3.generate({
    data: {
        columns: [
            ['data1', 300, 350, 300, 200, 150, 230],
        ],
        types: {
            data1: 'line',
        }
    },
        onresized: function () {
        updateErrorBars(); // need to be fixed..
    }

});

var errors = [50, 20, 30, 20, 40, 100];

var errorBars = d3.select('#chart svg .c3-chart').append('g');

errorBars.selectAll('path')
  .data(errors)
    .enter().append('path')
    .attr('class', function (d, i) { return 'error-line-' + i; });

function updateErrorBars() {
    d3.selectAll('.c3-line').each(function (d, i) {
     var dataLength = chart.data.values('data1').length
	for (i = 0; i<dataLength; i++){
        var segList = this.pathSegList,
            yPos = segList.getItem(i).y,
            xPos = (segList.getItem(i).x + segList.getItem(i).x) / 2;
            errorBars.select('.error-line-' + i)
            .attr('d', function (d) {
                return 'M' + xPos + ',' + (yPos + d/2) + ' ' +
                    'L' + xPos + ',' + (yPos - d/2) + ' ' +
                    'M' + (xPos - 5) + ',' + (yPos + d/2) + ' ' +
                    'L' + (xPos + 5) + ',' + (yPos + d/2) + ' ' +
                    'M' + (xPos - 5) + ',' + (yPos - d/2) + ' ' +
                    'L' + (xPos + 5) + ',' + (yPos - d/2) + ' ' +
                    'z';
            });
         }
    });
};
setTimeout(updateErrorBars, 500);This is an example for error bars in multiple datasets (line and bar at the same time).
Drawbacks:
//=========================================================================
function updateErrorBars(chartTypes){
   var lineKeyList = []
   var barKeyList = []
  for (var key in chartTypes)
  {
    if (chartTypes[key]=='line'){
    //alert("line" + key)
      lineKeyList.push(key)
    }
    else if (chartTypes[key]=='bar'){
    //alert("bar" + key)
      barKeyList.push(key)
    }
  }

  updateErrorBarsLine(lineKeyList)
  updateErrorBarsBar(barKeyList)
}

function updateErrorBarsLine(lineKeyList) {
		var loopCount = -1
    d3.selectAll('.c3-line').each(function (d, i) {
    loopCount++
    var segList = this.pathSegList
    var dataLength = segList.numberOfItems
    for (i = 0; i<dataLength; i++){
    	yPos = segList.getItem(i).y,
      xPos = (segList.getItem(i).x + segList.getItem(i).x) / 2;
      //alert('.error-line-data' + loopCount + '-' + i)
      errorBars.get(lineKeyList[loopCount]).select('.error-' + lineKeyList[loopCount] + '-' + i)
      .attr('d', function (d) {
      	return 'M' + xPos + ',' + (yPos + d/2) + ' ' +
        	'L' + xPos + ',' + (yPos - d/2) + ' ' +
          'M' + (xPos - 5) + ',' + (yPos + d/2) + ' ' +
          'L' + (xPos + 5) + ',' + (yPos + d/2) + ' ' +
          'M' + (xPos - 5) + ',' + (yPos - d/2) + ' ' +
          'L' + (xPos + 5) + ',' + (yPos - d/2) + ' ' +
          'z';
        });
      }
    });
};

function updateErrorBarsBar(barKeyList) {

    loopCount = 0;
    indx = -1
    len_data = dataLength.get(barKeyList[loopCount])
    d3.selectAll('.c3-bar').each(function (d, i) {
        indx++
        if (indx==len_data){
        	indx = 0
          loopCount++
          len_data = dataLength.get(barKeyList[loopCount])
        }
        var segList = this.pathSegList,
            yPos = segList.getItem(1).y,
            xPos = (segList.getItem(2).x + segList.getItem(0).x) / 2;


        errorBars.get(barKeyList[loopCount]).select('.error-' + barKeyList[loopCount] + '-' + indx)
            .attr('d', function (d) {
                return 'M' + xPos + ',' + (yPos + d/2) + ' ' +
                    'L' + xPos + ',' + (yPos - d/2) + ' ' +
                    'M' + (xPos - 5) + ',' + (yPos + d/2) + ' ' +
                    'L' + (xPos + 5) + ',' + (yPos + d/2) + ' ' +
                    'M' + (xPos - 5) + ',' + (yPos - d/2) + ' ' +
                    'L' + (xPos + 5) + ',' + (yPos - d/2) + ' ' +
                    'z';
            });

    });

 };

//=========================================================================
//main()
var chart = c3.generate({
    data: {
        columns: [
            ['data1', 300, 350, 300, 200, 150, 230],
            ['data2', 200, 280, 310, 130, 250],
            ['data3', 30, 30, 30, 30, 30, 30, 30, 30]
        ],
        types: {
            data1: 'line',
            data2: 'bar',
            data3: 'bar'
        }
    },
        onresized: function () {
        updateErrorBars(data); // need to be fixed..
    }

});

var errors1 = [50, 20, 30, 20, 40, 100];
var errors2 = [10, 10, 10, 10, 10];
var errors3 = [30, 30, 30, 30, 30, 30, 30, 30];

var errors = new Map()

errors.set('data1', errors1)
errors.set('data2', errors2)
errors.set('data3', errors3)

var chartTypes = {'data1' : 'line', 'data2' : 'bar', 'data3' : 'bar'}
dataLength=new Map();
for(var key in chartTypes){
  dataLength.set(key, errors.get(key).length);
}


var errorBars = new Map()
for(var key in chartTypes)
{
	errorBars.set(key, d3.select('#chart svg .c3-chart').append('g'));
  errorBars.get(key).selectAll('path')
  .data(errors.get(key))
    .enter().append('path')
    .attr('class', function (d, i) { return 'error-' + key + '-' + i; });
}

setTimeout(updateErrorBars(chartTypes), 500);Conclusion: It's not worth the effort.
MitkChart will only get error bars if the feature is implemented in C3js.