Page MenuHomePhabricator

How to display available statistics of segmentation
Open, WishlistPublic

Description

TASK FOR DISCUSSION
The optional --statistics flag will generate a file statistics.json with volume (in mm³) and mean intensity of each class. We can parse this into MITK, if needed.
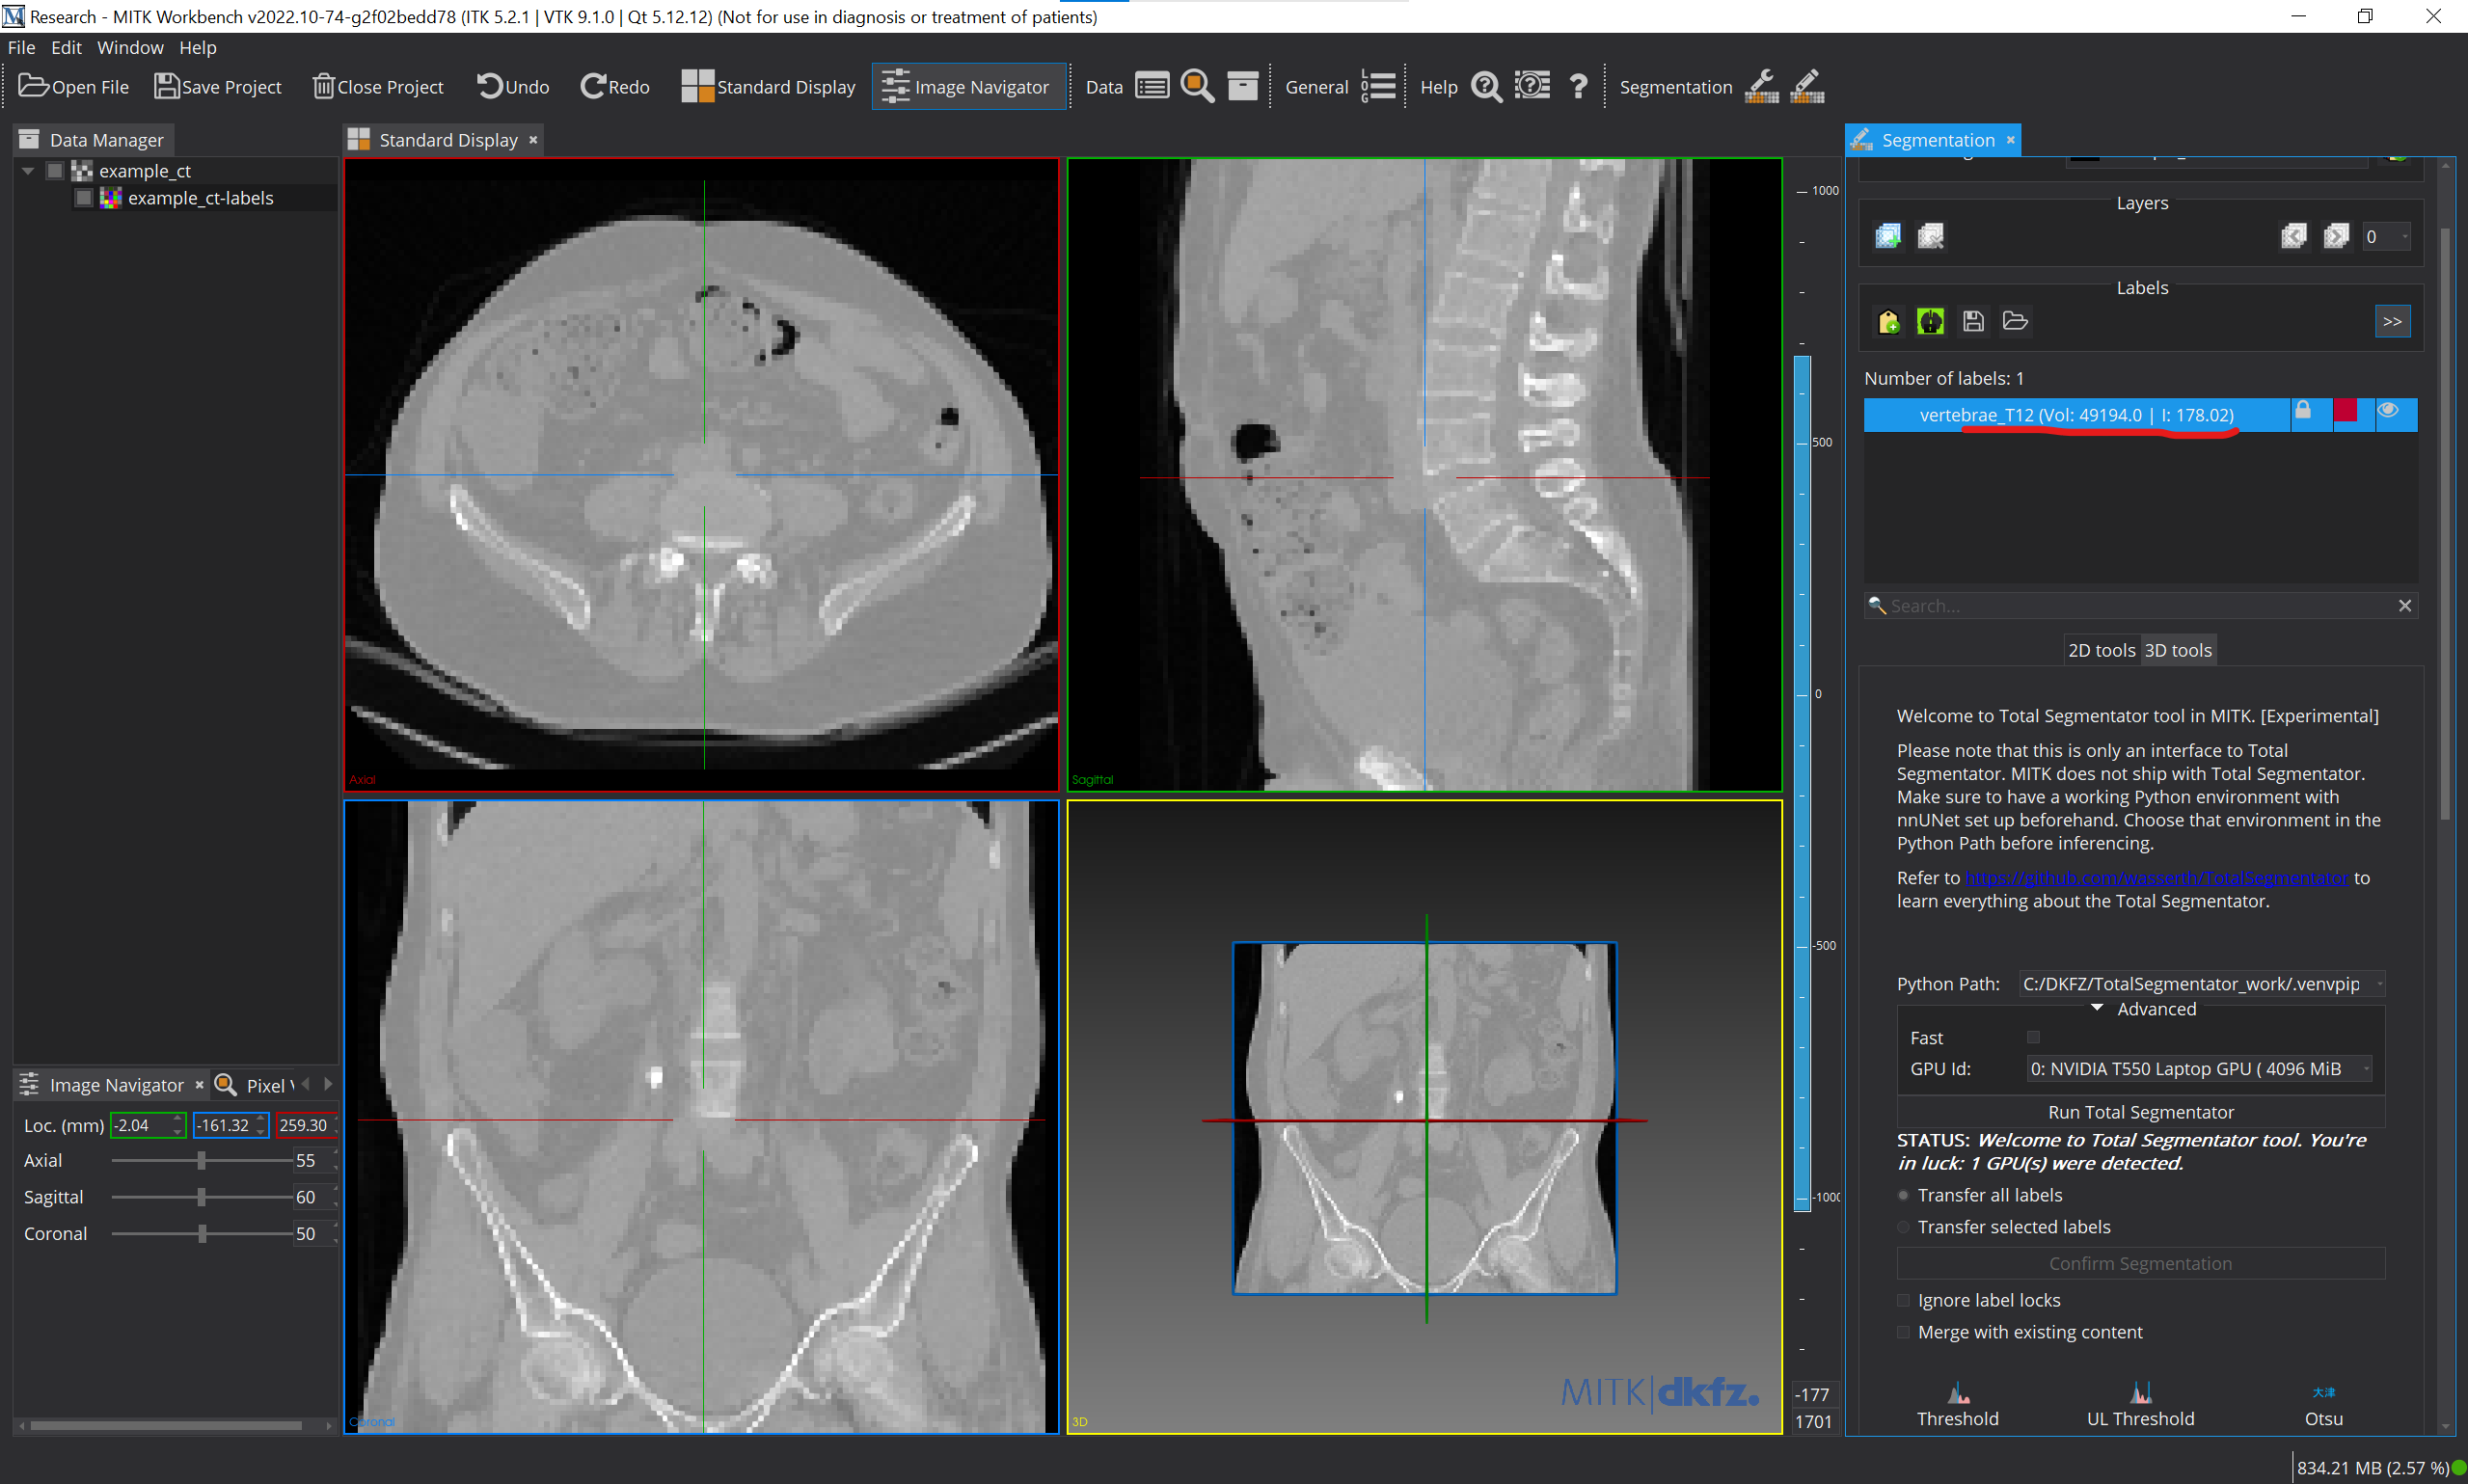
This is planned as one of the advanced options. Assuming we have a positive disposition to include the feature of TotalSegmentator in MITK, what's the best way to display statistics per label on UI?

Here is a sample JSON for reference:

"vertebrae_T12": {
        "volume": 49194.0,
        "intensity": 178.02
    },
    "vertebrae_T11": {
        "volume": 2052.0,
        "intensity": 294.45
    },
    "vertebrae_T10": {
        "volume": 0.0,
        "intensity": 0.0
    },

As we can see, if the volume or intensity is non-zero if the label is present in the output segmentation.

Event Timeline

mitk_tseg_stats.png (1×2 px, 459 KB)

How about something like this but in the Preview labels list? Once confirmed, this tail end info will can be pruned and only Label names are transferred.

floca triaged this task as Wishlist priority.Feb 22 2023, 1:40 PM

I see no value currently, as we have our own statistic backend/view.

Volume could be an information, but:

  1. it should be generaly supported and not depend on Segmentator
  2. I would add it through the planned feature of the new MVC classes to show arbitrary label props as additional columns.